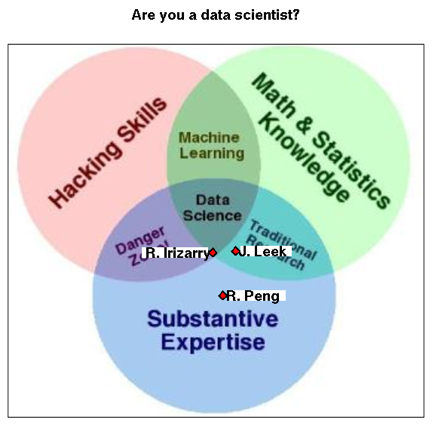
“Data scientist” is one of the buzzwords in the running for rebranding applied statistics mixed with some computing. David Champagne, over at Revolution Analytics, described the skills for being a data scientist with a Venn Diagram. Just for fun, I wrote a little R function for determining where you land on the data science Venn Diagram. Here is an example of a plot the function makes using the Simply Statistics bloggers as examples.
The code can be found here. You will need the png and klaR R packages to run the script. You also need to either download the file datascience.png or be connected to the internet.
Here is the function definition:
dataScientist(names=c(“D. Scientist”),skills=matrix(rep(1/3,3),nrow=1), addSS=TRUE, just=NULL)
- names = a character vector of the names of the people to plot
- addSS = if TRUE will add the blog authors to the plot
- just = whether to write the name on the right or the left of the point, just = “left” prints on the left and just =”right” prints on the right. If just=NULL, then all names will print to the right.
- skills = a matrix with one row for each person you are plotting, the first column corresponds to “hacking”, the second column is “substantive expertise”, and the third column is “math and statistics knowledge”
So how do you define your skills? Here is how it works:
If you are an academic
You calculate your skills by adding papers in journals. The classification scheme is the following:
- Hacking = sum of papers in journals that are primarily dedicated to software/computation/methods for very specific problems. Examples are: Bioinformatics, Journal of Statistical Software, IEEE Computing in Science and Engineering, or a software article in Genome Biology.
- Substantive = sum of papers in journals that primarily publish scientific results such as JAMA, New England Journal of Medicine, Cell, Sleep, Circulation
- Math and Statistics = sum of papers in primarily statistical journals including Biostatistics, Biometrics, JASA, JRSSB, Annals of Statistics
Some journals are general, like Nature, Science, the Nature sub-journals, PNAS, and PLoS One. For papers in those journals, assess which of the areas the paper falls in by determining the main contribution of the paper in terms of the non-academic classification below.
If you are a non-academic
Since papers aren’t involved, determine the percent of your time you spend on the following things:
- Hacking = downloading/transferring data, cleaning data, writing software, combining previously used software
- Substantive = time you spend learning about the scientific problem, discussing with scientists, working in the lab/field.
- Math and Statistics = time you spend formalizing a problem in mathematical notation, time you spend developing new mathematical/statistical theory, time you spend developing general method.
Enjoy!