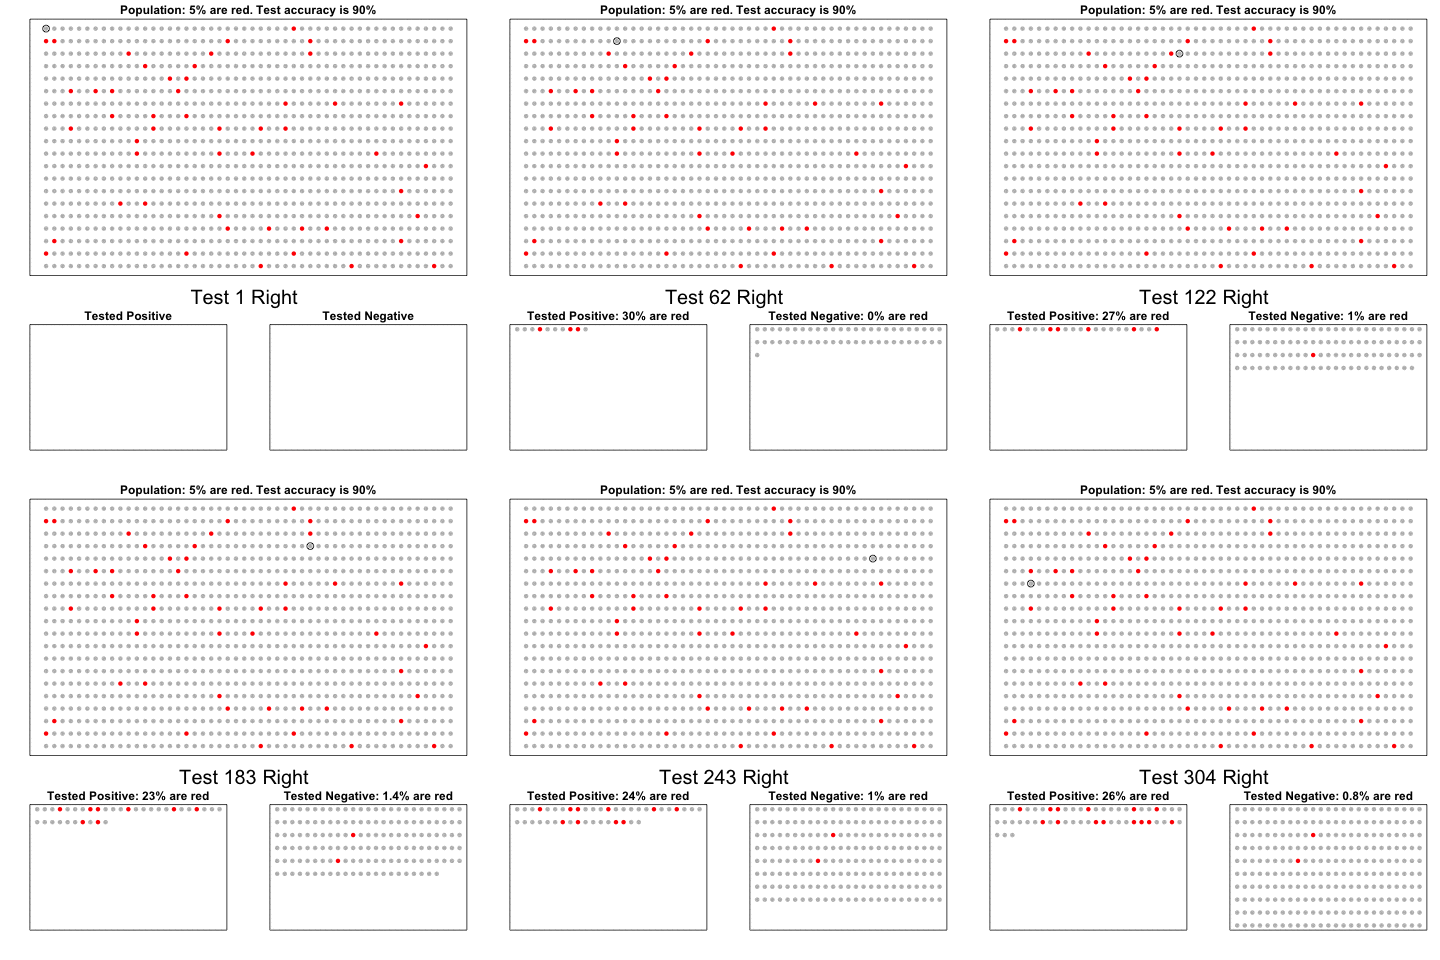
Say Pr(A)=5% is the prevalence of a disease (% of red dots on top fig). Each individual is given a test with accuracy Pr(B|A)=Pr(no B| no A) = 90% . The O in the middle turns into an X when the test fails. The rate of Xs is 1-Pr(B|A). We want to know the probability of having the disease if you tested positive: Pr(A|B). Many find it counterintuitive that this probability is much lower than 90%; this animated gif is meant to help.

The individual being tested is highlighted with a moving black circle. Pr(B) of these will test positive: we put these in the bottom left and the rest in the bottom right. The proportion of red points that end up in the bottom left is the proportion of red points Pr(A) with a positive test Pr(B|A), thus Pr(B|A) x Pr(A). Pr(A|B), or the proportion of reds in the bottom left, is therefore Pr(B|A) x Pr(A) divided by Pr(B): Pr(A|B)=Pr(B|A) x Pr(A) / Pr(B)
ps - Is this a frequentist or Bayesian gif?