Biologists make wide use of correlation as a measure of reproducibility. Specifically, they quantify reproducibility with the correlation between measurements obtained from replicated experiments. For example, the ENCODE data standards document states
A typical R2 (Pearson) correlation of gene expression (RPKM) between two biological replicates, for RNAs that are detected in both samples using RPKM or read counts, should be between 0.92 to 0.98. Experiments with biological correlations that fall below 0.9 should be either be repeated or explained.
However, for reasons I will explain here, correlation is not necessarily informative with regards to reproducibility. The mathematical results described below are not inconsequential theoretical details, and understanding them will help you assess new technologies, experimental procedures and computation methods.
Suppose you have collected data from an experiment
x1, x2,…, xn
and want to determine if a second experiment replicates these findings. For simplicity, we represent data from the second experiment as adding unbiased (averages out to 0) and statistically independent measurement error d to the first:
y1=x1+d1, y2=x2+d2, … yn=xn+dn.
For us to claim reproducibility we want the differences
d1=y1-x1, d2=y2-x2,… ,dn=yn-xn
to be “small”. To give this some context, imagine the x and y are log scale (base 2) gene expression measurements which implies the d represent log fold changes. If these differences have a standard deviation of 1, it implies that fold changes of 2 are typical between replicates. If our replication experiment produces measurements that are typically twice as big or twice as small as the original, I am not going to claim the measurements are reproduced. However, as it turns out, such terrible reproducibility can still result in correlations higher than 0.92.
To someone basing their definition of correlation on the current common language usage this may seem surprising, but to someone basing it on math, it is not. To see this, note that the mathematical definition of correlation tells us that because d and x are independent:

This tells us that correlation summarizes the variability of d relative to the variability of x. Because of the wide range of gene expression values we observe in practice, the standard deviation of x can easily be as large as 3 (variance is 9). This implies we expect to see correlations as high as 1/sqrt(1+1/9) = 0.95, despite the lack of reproducibility when comparing x to y.
Note that using Spearman correlation does not fix this problem. A Spearman correlation of 1 tells us that the ranks of x and y are preserved, yet doest not summarize the actual differences. The problem comes down to the fact that we care about the variability of d and correlation, Pearson or Spearman, does not provide an optimal summary. While correlation relates to the preservation of ranks, a much more appropriate summary of reproducibly is the distance between x and y which is related to the standard deviation of the differences d. A very simple R command you can use to generate this summary statistic is:
sqrt(mean(d^2))
or the robust version:
median(abs(d)) ##multiply by 1.4826 for unbiased estimate of true sd
The equivalent suggestion for plots it to make an MA-plot instead of a scatterplot.
But aren’t correlations and distances directly related? Sort of, and this actually brings up another problem. If the x and y are standardized to have average 0 and standard deviation 1 then, yes, correlation and distance are directly related:

However, if instead x and y have different average values, which would put into question reproducibility, then distance is sensitive to this problem while correlation is not. If the standard devtiation is 1, the formula is:

Once we consider units (standard deviations different from 1) then the relationship becomes even more complicated. Two advantages of distance you should be aware of are:
- it is in the same units as the data, while correlations have no units making it hard to interpret and select thresholds, and
- distance accounts for bias (differences in average), while correlation does not.
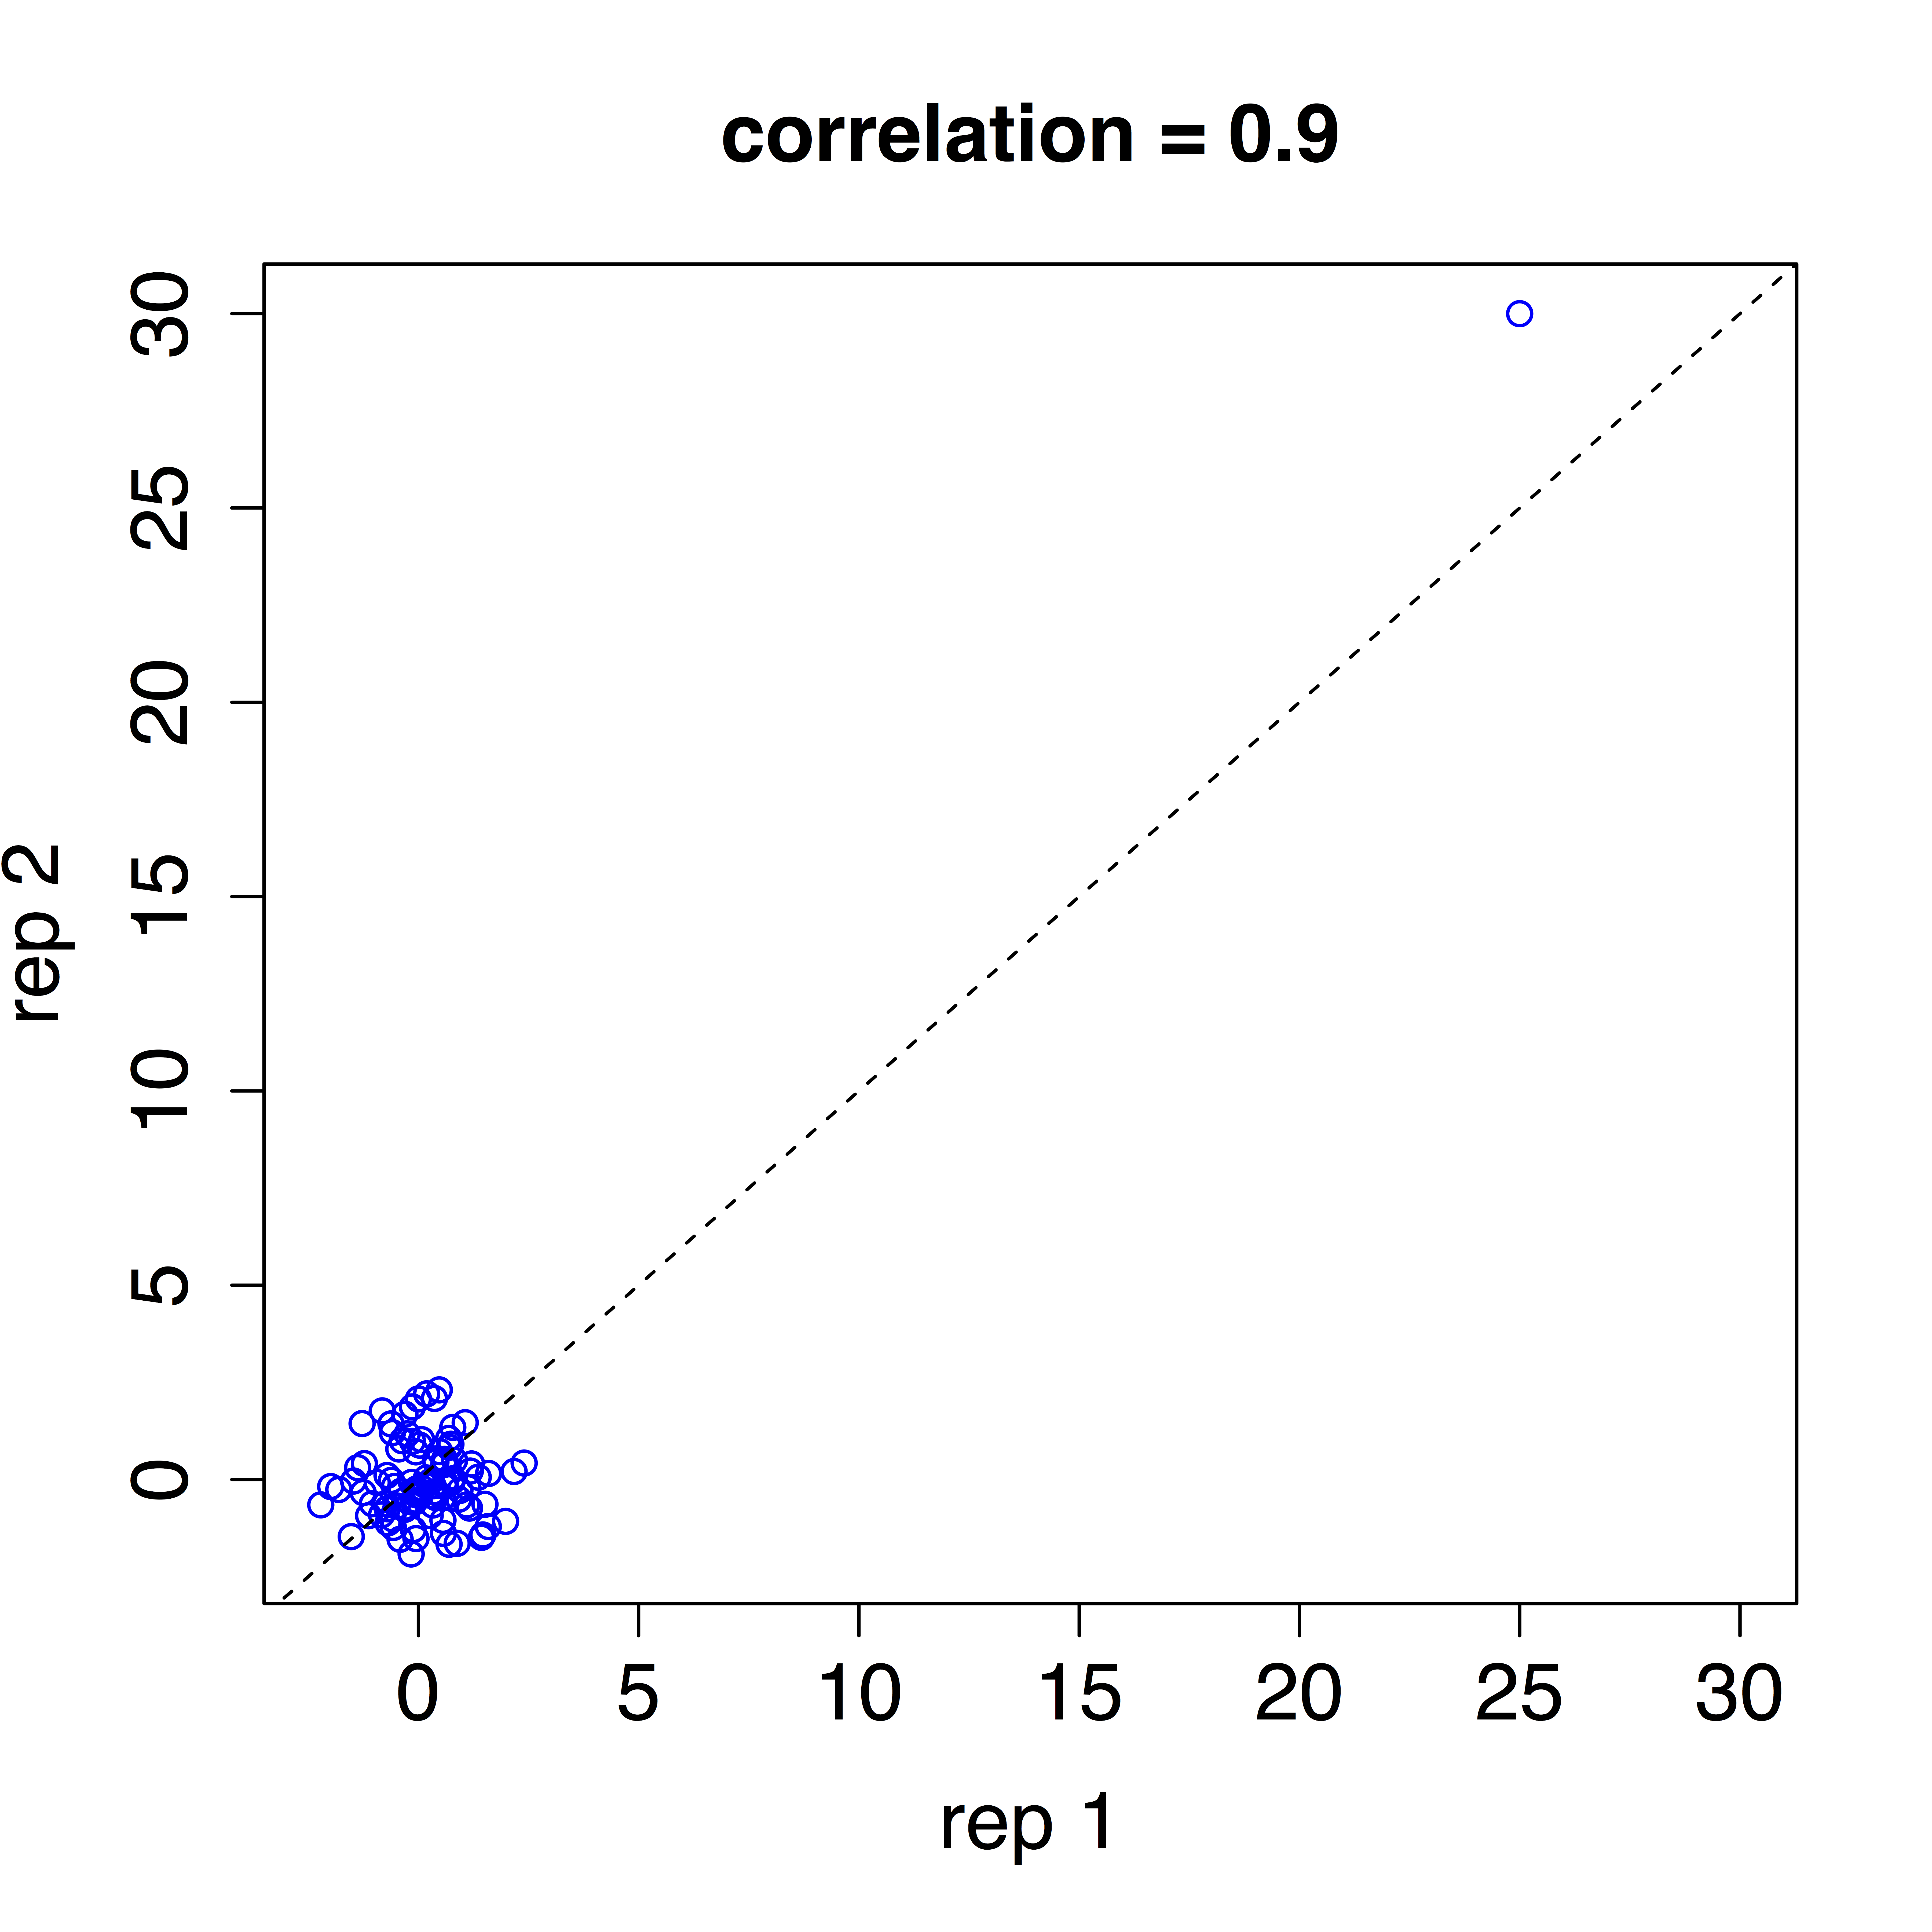
A final important point relates to the use of correlation with data that is not approximately normal. The useful interpretation of correlation as a summary statistic stems from the bivariate normal approximation: for every standard unit increase in the first variable, the second variable increased r standard units, with r the correlation. A summary of this is here. However, when data is not normal this interpretation no longer holds. Furthermore, heavy tail distributions, which are common in genomics, can lead to instability. Here is an example of uncorrelated data with a single pointed added that leads to correlations close to 1. This is quite common with RNAseq data.