Tidy data at its heart is a set of three rules for organizing a data set:
- Each variable forms a column.
- Each observation forms a row.
- Each type of observational unit forms a table.
This is an incredibly useful abstraction for thinking about organizing data sets for analysis. In particular any data set that can be conveniently rectangled to look like this fun diagram from Jenny Bryan

can then be assumed to have a common form and structure. This makes it much easier to write tools that operate on - because the format is standardized. Since then a whole suite of R packages have sprung up called the tidyverse (along with a host of other packages not in the official tidyverse) that operate on data of this variety.
Tidy data is great for a huge fraction of data analyses you might be interested in. It makes organizing, developing, and sharing data a lot easier. Its how I recommend most people share data and I’ve recently even written an entire NIH grant around the idea of tidy health data libraries.
But it starts to feel restrictive when you have to deal with edge cases like nested data sets, or data that are very large and lead to repetitive tidy data, or data that are best operated on as matrices. These non-tidy data represent a relatively small fraction of most data analysis being performed. For those analyses there are smart, organized things you can do, but the usefulness of the absraction often breaks down.
Lately I’ve been thinking a lot about what an equivalent set of rules for data analysis would be. I’ve written a book on data analysis which is essentially an extended checklist of rules of thumb. But I started to wonder, could we come up with a useful and simpler abstraction for data analysis? In particular I was interested in the question of whether we could come up with a set of three rules that would cover the broad majority of data analyses being done in practice and would simplify our evaluation and understanding of those analyses. It would also simplify the tool building for data analysis by restricting the space of choices. By necessity three rules will lead to some discomfort for edge cases just like the tidy data abstraction runs into discomfort around the edges. But for this exercise I’m willing to accept that level of discomfort.
After thinking about it for a little while I settled on the following three rules and I’d love to get peoples feedback. A “tidy” analysis is one where:
- It answers a single quantitative question that can be defined in terms of a parameter.
- It uses a training set to do all model building and a test set to evaluate all model building.
- It uses only linear models.
I’ve told a few people about this idea and I’ve gotten reactions from laughter to lukewarm agreement to pushback. So I thought I’d give some justification for these rules.
A single quantitative question defined by a parameter
As any applied/consulting statistician will tell you, a huge part of the job of working with collaborators is defining the question. In my experience, one of the key predictors of the success of a project is whether we can identify a single concrete and quantifiable question. In most data science/statistical consulting classes, a large amount of effort is dedicated to figuring out what question is being asked and how we can turn that into a quantitative statement. So any tidy analysis will lead with a single question defined in terms of a concrete parameter - this avoids the type of analysis where you see 1000 different plots, sub-analyses, and diversions.
Training and test sets
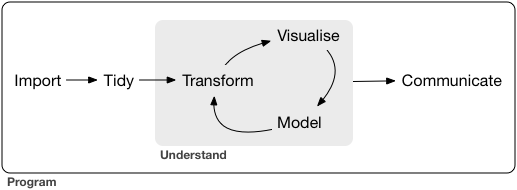
There are various models for the data analytic process, but most of them are defined in terms of a cycle. For example here is the process as defined by Hadley Wickham’s book R for Data Science
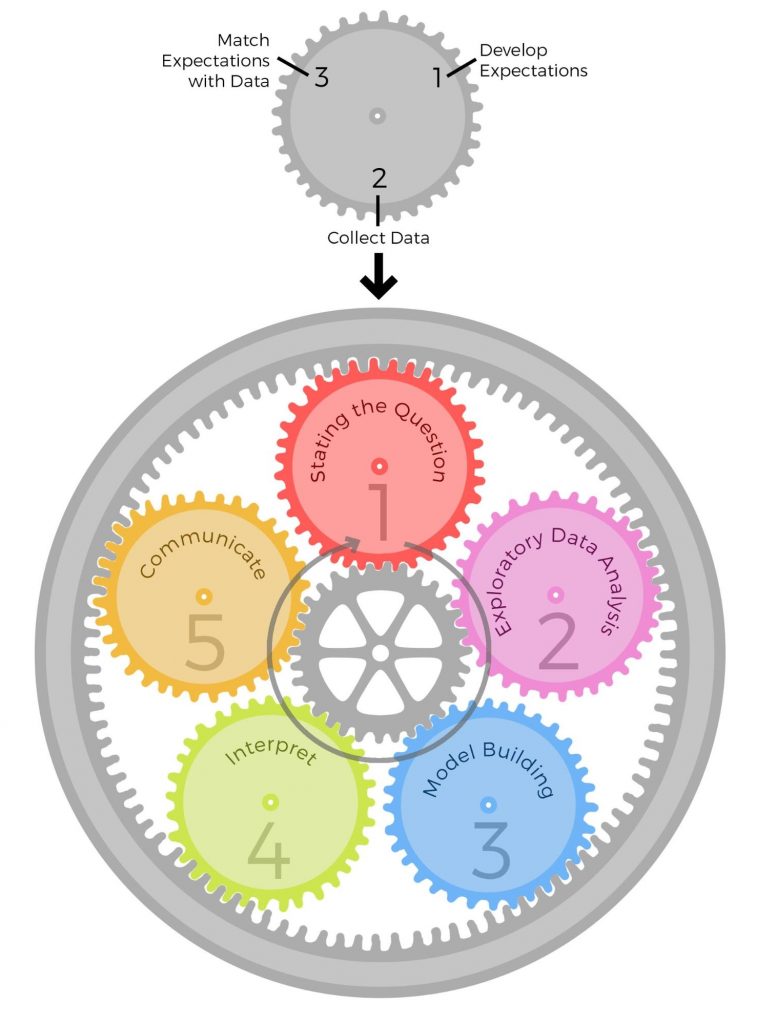
Another example is in the book The Art of Data Science:
The trouble with this cyclic view of data science is that it opens the door to p-hacking and the garden of forking paths because you never know if the plot, processing step, or analysis you did is following signal or noise. As we have known for a long time the best way to avoid these overfitting problems is to evaluate the results of your analysis in a held out set. This would apply regardless of if you are doing inference, exploratory analysis, or prediction.
Linear models
This one has been the most controversial when I’ve proposed this approach. But I think one of the best solutions to reducing researcher degrees of freedom is to reduce researcher degrees of freedom. Linear models are an incredibly useful tool and can be used for ANOVA, for modeling, for visualization, for prediction and a number of other tasks. Moreover, they have the benefit of being one of the more interpretable models. Perhaps most importantly in a linear model you know the exact relationship between any of the covariates and the outcome you are trying to evaluate.
Early in my career I often made the mistake of trying a linear model first, seeing no or little signal, and then wasting a lot of time trying fancier models. Almost inevitably, if you can’t see the signal with a suitable linear model, you won’t be able to find it with fancier methods. The fancier methods may just serve to make the signal stronger. So as a first pass I’d always like to see the linear model result to establish a baseline.
This does leave out some types of analysis such as unsupervised analysis. But I think that is the point, the goal is to find a set of rules that covers the majority of analyses, allows us to templatize/organize ourselves, and removes the most common barriers to working together.