Roughly once a year, I read John Tukey’s paper “The Future of Data Analysis”, originally published in 1962 in the Annals of Mathematical Statistics. I’ve been doing this for the past 17 years, each time hoping to really understand what it was he was talking about. Thankfully, each time I read it I seem to get something new out of it. For example, in 2017 I wrote a whole talk around some of the basic ideas.
Well, it’s that time of year again, and I’ve been doing some reading.
Probably the most famous line from this paper is
Far better an approximate answer to the right question, which is often vague, than an exact answer to the wrong question, which can always be made precise.
The underlying idea in this sentence arises in at least two ways in Tukey’s paper. First is his warning that statisticians should not be called upon to produce the “right” answers. He argues that the idea that statistics is a “monolithic, authoritarian structure designed to produce the ‘official’ results” presents a “real danger to data analysis”. Second, Tukey criticizes the idea that much of statistical practice centers around optimizing statistical methods around precise (and inadequate) criteria. One can feel free to identify a method that minimizes mean squared error, but that should not be viewed as the goal of data analysis.
But that got me thinking—what is the ultimate goal of data analysis? In 64 pages of writing, I’ve found it difficult to identify a sentence or two where Tukey describes the ultimate goal, why it is we’re bothering to analyze all this data. It occurred to me in this year’s reading of the paper, that maybe the reason Tukey’s writing about data analysis is often so confusing to me is because his goal is actually quite different from that of the rest of us.
More Questions, Better Questions
Most of the time in data analysis, we are trying to answer a question with data. I don’t think it’s controversial to say that, but maybe that’s the wrong approach? Or maybe, that’s what we’re not trying to do at first. Maybe what we spend most of our time doing is figuring out a better question.
Hilary Parker and I have discussed at length the idea of design thinking on our podcast. One of the fundamental ideas from design thinking involves identifying the problem. It’s the first “diamond” in the “double diamond” approach to design.
Tukey describes the first three steps in a data analysis as:
- Recognition of problem
- One technique used
- Competing techniques used
In other words, try one approach, then try a bunch of other approaches! You might be thinking, why not just try the best approach (or perhaps the right approach) and save yourself all that work? Well, that’s the kind of path you go down when you’re trying to answer the question. Stop doing that! There are two reasons why you should stop thinking about answering the question:
- You’re probably asking the wrong question anyway, so don’t take yourself too seriously;
- The “best” approach is only defined as “best” according to some arbitrary criterion that probably isn’t suitable for your problem/question.
After thinking about all this I was inspired to draw the following diagram.
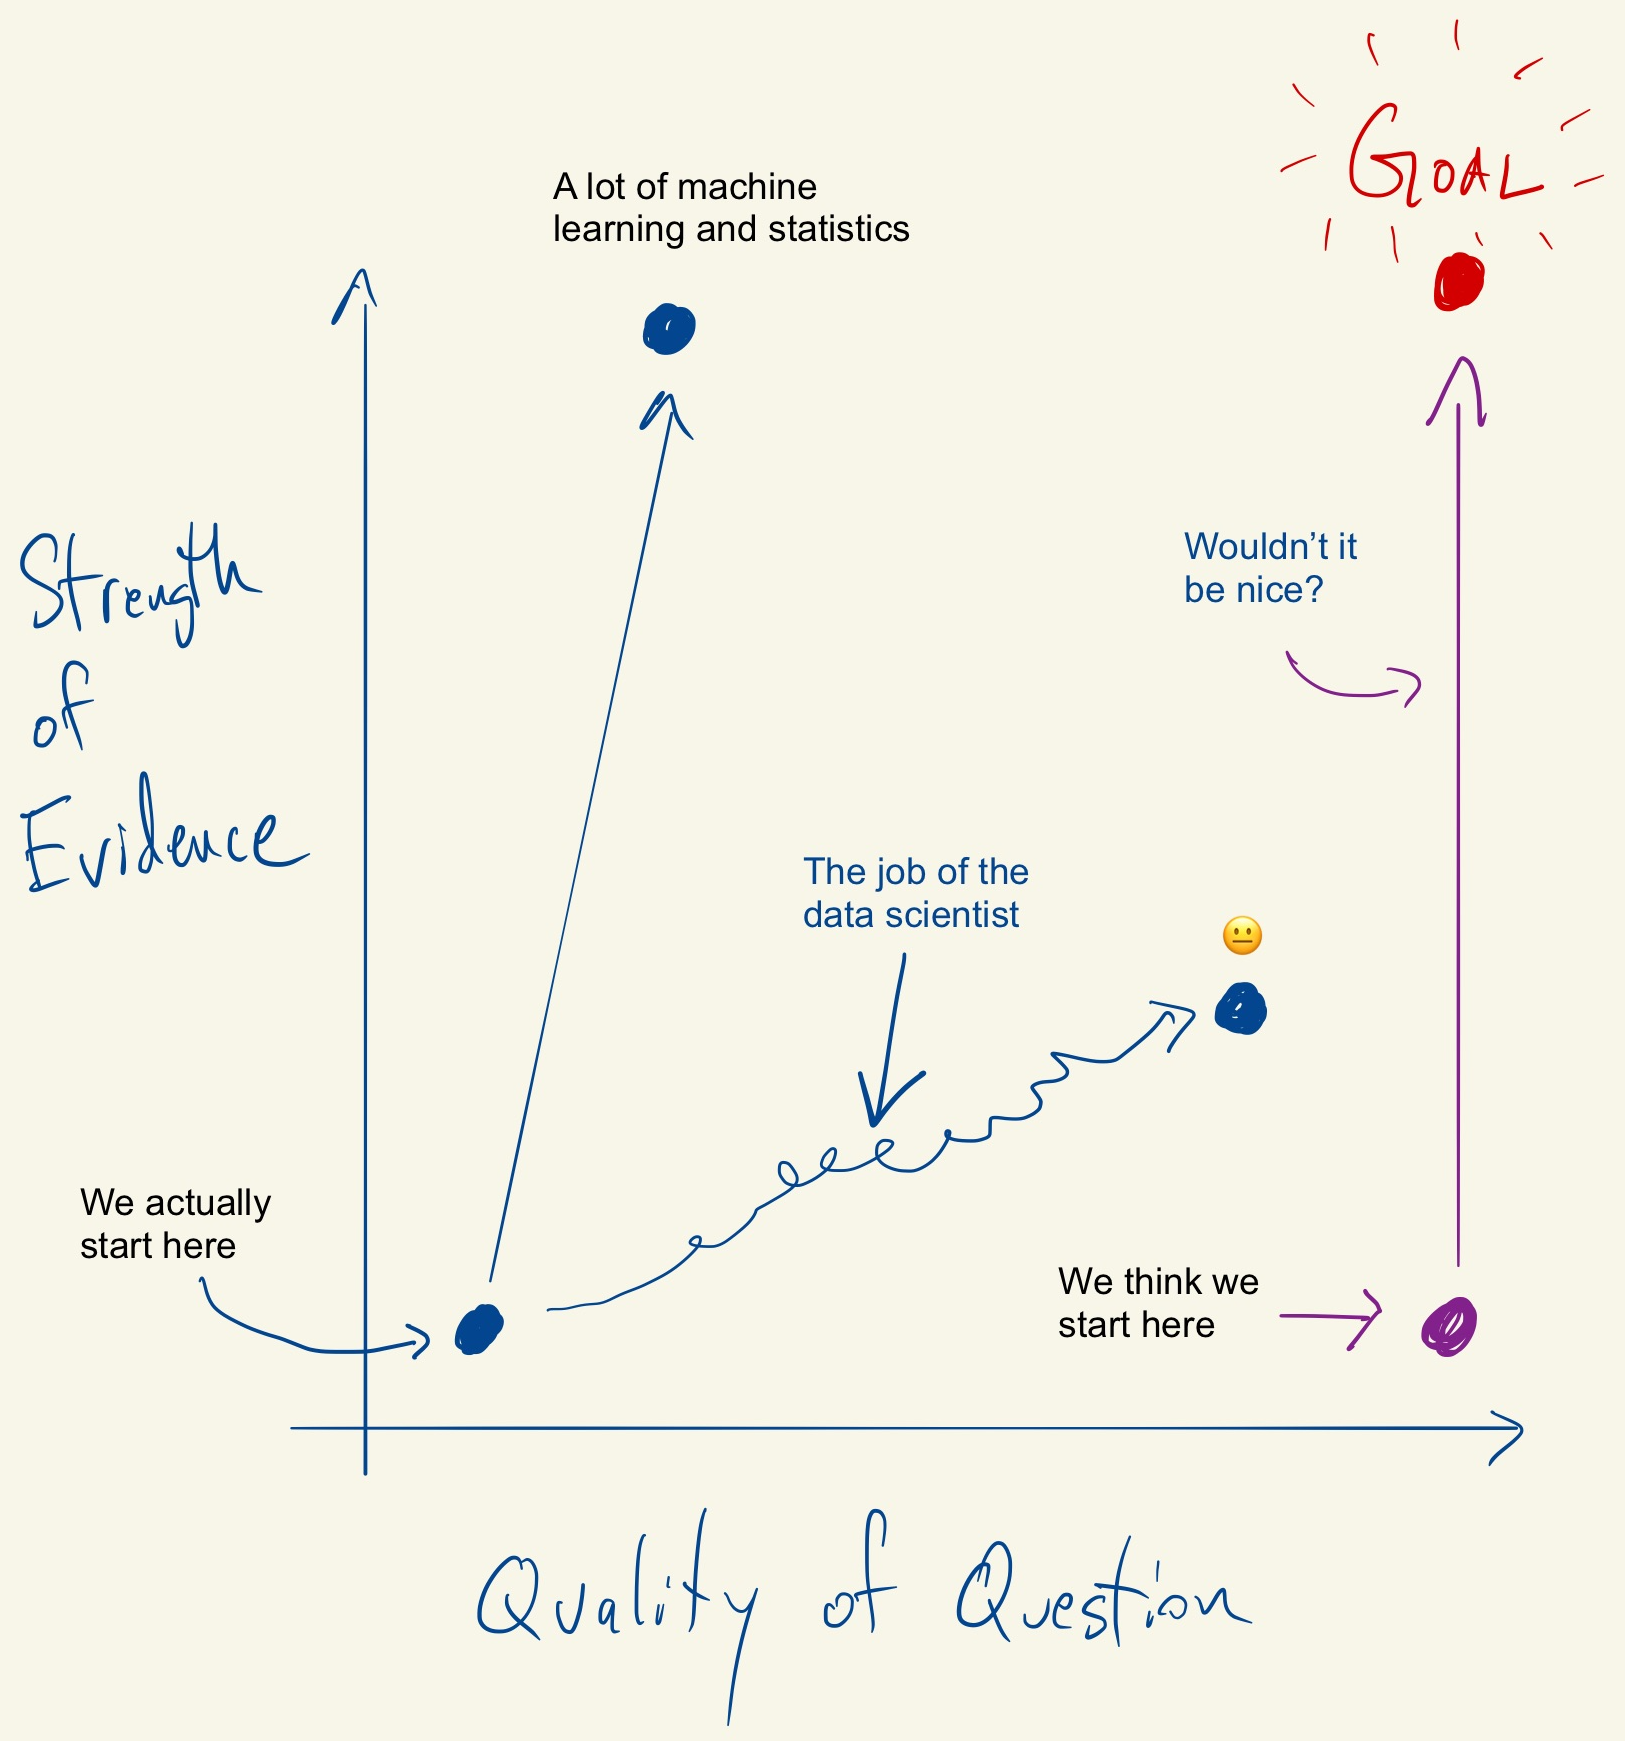
The goal in this picture is to get to the upper right corner, where you have a high quality question and very strong evidence. In my experience, most people assume that they are starting in the bottom right corner, where the quality of the question is at its highest. In that case, the only thing left to do is to choose the optimal procedure so that you can squeeze as much information out of your data. The reality is that we almost always start in the bottom left corner, with a vague and poorly defined question and a similarly vague sense of what procedure to use. In that case, what’s a data scientist to do?
In my view, the most useful thing a data scientist can do is to devote serious effort towards improving the quality and sharpness of the question being asked. On the diagram, the goal is to move us as much as possible to the right hand side. Along the way, we will look at data, we will consider things outside the data like context, resources and subject matter expertise, and we will try a bunch of different procedures (some optimal, some less so).
Ultimately, we will develop some of idea of what the data tell us, but more importantly we will have a better sense of what kinds of questions we can ask of the data and what kinds of questions we actually want to have answered. In other words, we can learn more about ourselves by looking at the data.
Exploring the Data
It would seem that the message here is that the goal of data analysis is to explore the data. In other words, data analysis is exploratory data analysis. Maybe this shouldn’t be so surprising given that Tukey wrote the book on exploratory data analysis. In this paper, at least, he essentially dismisses other goals as overly optimistic or not really meaningful.
For the most part I agree with that sentiment, in the sense that looking for “the answer” in a single set of data is going to result in disappointment. At best, you will accumulate evidence that will point you in a new and promising direction. Then you can iterate, perhaps by collecting new data, or by asking different questions. At worst, you will conclude that you’ve “figured it out” and then be shocked when someone else, looking at another dataset, concludes something completely different. In light of this, discussions about p-values and statistical significance are very much beside the point.
The following is from the very opening of Tukey’s book *Exploratory Data Analysis:
It is important to understand what you CAN DO before you learn to measure how WELL you seem to have DONE it
(Note that the all caps are originally his!) Given this, it’s not too surprising that Tukey seems to equate exploratory data analysis with essentially all of data analysis.
Better Questions
There’s one story that, for me, totally captures the spirit of exploratory data analysis. Legend has it that Tukey once asked a student what were the benefits of the median polish technique, a technique he invented to analyze two-way tabular data. The student dutifully answered that the benefit of the technique is that it provided summaries of the rows and columns via the row- and column-medians. In other words, like any good statistical technique, it summarized the data by reducing it in some way. Tukey fired back, saying that this was incorrect—the benefit was that the technique created more data. That “more data” was the residuals that are leftover in the table itself after running the median polish. It is the residuals that really let you learn about the data, discover whether there is anything unusual, whether your question is well-formulated, and how you might move on to the next step. So in the end, you got row medians, column medians, and residuals, i.e. more data.
If a good exploratory technique gives you more data, then maybe good exploratory data analysis gives you more questions, or better questions. More refined, more focused, and with a sharper point. The benefit of developing a sharper question is that it has a greater potential to provide discriminating information. With a vague question, the best you can hope for is a vague answer that may not lead to any useful decisions. Exploratory data analysis (or maybe just data analysis) gives you the tools that let the data guide you towards a better question.